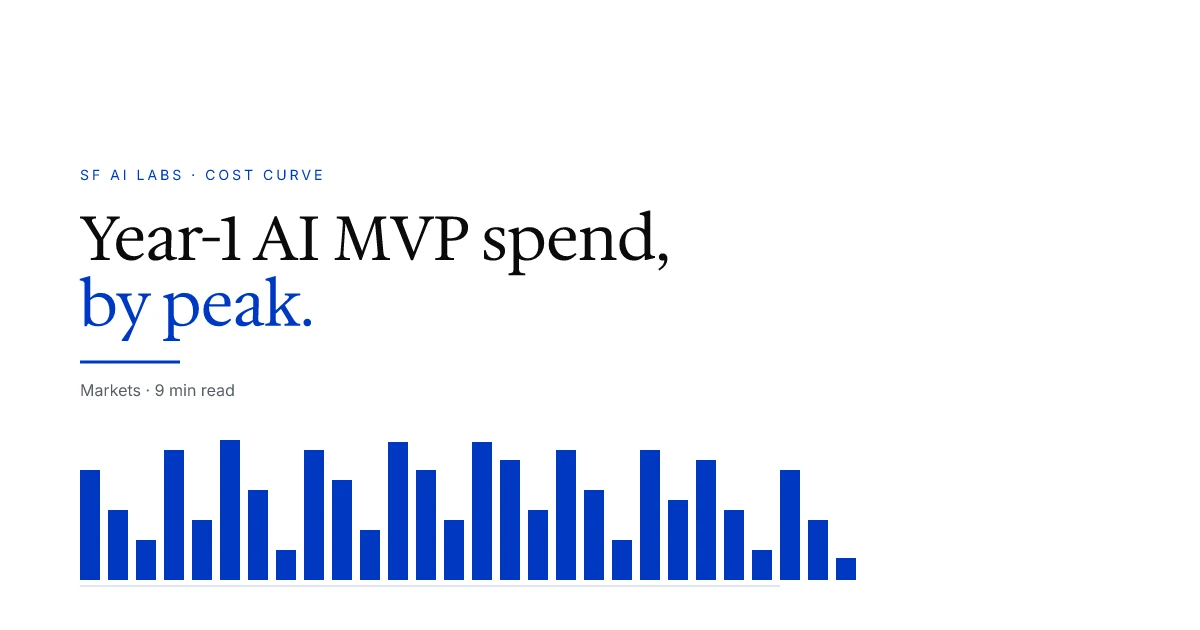
A 2026 AI MVP does not spend its first $200K in a straight line. It spends them in two crests and a trough — a build crest in M2–M3, a launch crest in M4–M5, a quiet plateau in M6–M8, and a third smaller spike between M7 and M11 when a frontier model migration and an on-call breakdown stack. Founders who model year one as a flat retainer, or as a single SOW followed by silence, are budgeting against a curve that does not exist. The shape matters because cashflow planning, milestone billing, and the M9 CFO conversation are about when the dollars land, not just how many. This piece reshapes the year-1 budget from a sum into a curve, names the four peaks by the mechanism that creates them, and ends with a self-test against any vendor proposal.
An analytical companion to the AI MVP economics playbook and the broader idea-to-product manifesto. For the single headline number, see how much does an AI MVP cost in 2026; for the month-by-month walk-through, see AI MVP launch costs vs ongoing costs. This piece reframes the same $200K as a curve.
The two-crest year-1 curve, at a glance
The central case below assumes a typical 2026 AI MVP — single-workflow, MVP-1 scale (1K–10K queries per day), founder-led on business, vendor-built on engineering, $150K launch invoice across M1–M5, $5–8K average run-rate across M6–M12. Total year-1 spend: roughly $200K.
That $200K does not land evenly:
| Month | Phase | Spend | Driver |
|---|---|---|---|
| M1 | Planning & PRD | $15K | One-time intake + eval-bound PRD |
| M2 | Build (early) | $40K | Architecture decision + eval scaffold + first sprint |
| M3 | Build (mid) | $50K | Peak engineer density, integration surface |
| M4 | Build (late) + hardening | $35K | Hardening sprint, observability stand-up |
| M5 | Launch | $30K | Hardening tail + first month inference |
| M6 | Stabilisation | $5K | First full run-rate month |
| M7 | First eval cycle | $6K | Eval re-run + minor feature work |
| M8 | Pre-migration | $6K | Quiet month — the trap |
| M9 | Model migration crest | $11K | New frontier alias drops, eval re-run, on-call strain begins |
| M10 | Migration tail | $9K | Retuning, routing fix, on-call retainer renegotiation |
| M11 | Post-migration stabilised | $6K | New equilibrium |
| M12 | Year-2 planning | $5K | Roadmap, retainer reshape |
| Total | ~$218K |
Two crests and a trough, with a third spike layered on the late half of the year. Each peak has a discrete mechanism. Mis-funding any one is the cost-overrun pattern this article exists to name.
The shape resists default budget conversations. “What is the retainer?” assumes a flat line. “What is the SOW?” assumes a single capital event. The curve is neither — it is a sequence of named events, and the cashflow plan has to schedule each one. The 80–85% pilot stall rate McKinsey reports across State of AI editions is a budget-shape story: the pilots that stall funded the build crest, missed the launch crest, and ran out of buffer before the migration crest landed.
Peak 1 — Build crest, M2–M3
The first peak is the build crest — M2 and M3, $40–50K per month, about 45% of year-1 spend in two months.
The mechanism is engineer density. The team runs three workstreams in parallel — architecture (model, infra, vector-store), eval scaffolding (the M1 PRD test set built and rubric-anchored), and the first integration sprint. Three workstreams means three or four engineer-equivalents on payroll simultaneously. The bill is high because density is high, not because the work is exotic.
The shape is predictable. A 6-week build runs M2 ($40K) plus M3 ($50K). A 12-week build extends to M4 at similar density then drops sharply. The most variable cost line inside the peak is eval engineering — a line that did not exist in a 2018 SaaS MVP budget and that runs 20–35% of the peak today. The argument for funding it: stop paying AI agencies for documentation, pay them for evals.
The common under-funding mistake is treating the build crest as a single bucket — a $90K “build” line — and watching it run 30% over because the eval scaffold and the architecture decision were priced into the same bucket as feature code. Decomposing the bucket: AI MVP economics playbook.
Peak 2 — Launch crest, M4–M5
The second peak is the launch crest — M4 and M5, $30–35K per month, roughly 30% of year-1 spend.
The mechanism is overlap. Hardening (final eval pass, observability stand-up, security review, on-call runbook) is still being invoiced when the first month of live inference begins. The launch crest is the only window where two cost lines run in parallel — project (hardening tail) and operating (first inference, observability storage, first vector-store usage). Most budget templates either double-count the overlap (budget runs over) or zero it (founder discovers M4–M5 was a $15K gap).
Cost-line distribution: hardening engineering 50%, first-month inference 15%, observability stand-up 15%, eval suite finalisation 15%, contingency 5%. Founders cut hardening first — and its cut shows up worst in M6–M12. Skip it and the M5 launch ships with no on-call runbook, no eval-replay retention, and a secret-management posture one developer rotation away from breaking. Cost surfaces in the next two peaks.
Before M5 the line is bursty and project-shaped; after M5 it is recurring. Treating them as one is the source of most year-1 budget surprises.
The plateau and the quiet trap, M6–M8
M6 through M8 are the quiet months. The bill drops to $5–6K, the team relaxes, and the founder concludes the budget conversation is over. This is the trap.
The plateau is real — usage is light, the eval suite is fresh, the M2 alias has not shipped a successor yet. But the plateau hides two cost events almost certain to land in the back half: a frontier model migration and an on-call breakdown. Founders who pace the retainer down to its floor end up under-funding the late-year crests by the gap they harvested.
A defensible plateau retainer holds the eval engineering line at 30–50% of run-rate (not 10–15%) and keeps a model-migration buffer of roughly $8–12K un-spent. See decoding AI project TCO: 7 cost lines most CFOs miss — the line CFOs cut most often is the one that costs them most three months later.
Peak 3 — First model migration, M7–M9
The third peak is the first model migration — typically M7 to M9, adding $5–10K of one-time engineering on top of run-rate, roughly 5% of year-1 spend.
The mechanism is alias drift. Frontier-model behaviour changes on cycles of weeks. Anthropic, OpenAI, and Google each ship multiple major variant updates per year, tracked on the Artificial Analysis LLM Leaderboard. A product pinned to an alias rather than a fixed snapshot will, with high probability, experience at least one behaviour-relevant update in M6–M12.
A migration costs across four lines: eval re-run end-to-end ($2–4K), prompt/scaffold retuning if scoring drops ($2–4K), routing-layer adjustment if pricing shifts ($1–2K), observability dashboards re-anchored ($500–$1K). Total $5–10K of bursty spend on a $5–6K plateau month — which is why M9 typically lands at $11K rather than $6K.
The migration crest is the most under-budgeted line in year one. Retainers price it at zero, then either absorb it (retainer over) or skip it (product drifts away from the eval contract). Naming it explicitly — even at $0 expected, $10K bounded — is the cheapest fix available at the M5 retainer.
Peak 4 — On-call burnout, M9–M11
The fourth peak is on-call burnout — typically M9 to M11, $3–8K per month for two to three months, roughly 5% of year-1 spend.
The mechanism is human throughput. At M5 the founder is the on-call: usage is light, incidents are weekly, the founder absorbs them in evening hours. By M9 usage has ramped (10x to 100x in many B2B MVPs that find product-market fit, even in design-partner mode), incidents are daily, and the founder hits a wall the budget did not anticipate. The cost line is either a fractional engineer added to the on-call rotation ($3–5K per month at MVP-1) or a retained incident-response vendor ($1–2K per month plus per-incident hourly).
The burnout peak interacts with the migration peak. A migration often triggers burnout — the new alias introduces a regression the eval suite catches but production traffic hits before the fix lands, the founder runs an incident, then a second, then a third, and concludes by M10 that the on-call retainer has to change. That is why M9, M10, and M11 all sit elevated above the plateau.
The peak is preventable. Fund the on-call retainer at the launch crest before M5, rather than discovering it at M9. It is the same argument the economics playbook makes about the hardening line — pay upfront or pay 3x later. Anti-pattern catalogue: anatomy of a runaway AI project: 5 cost-side root causes.
Expectation vs reality: where founders mis-weight the year
The expectation-vs-reality table is the cleanest way to see why year-1 budgets miss.
| Phase | What founders expect | What actually lands | Mis-weight |
|---|---|---|---|
| Build (M2–M3) | 60% of year-1 spend | 45% | Over-weighted by 15 pts |
| Launch (M4–M5) | 25% | 30% | Roughly right |
| Plateau (M6–M8) | 10% | 8% | Roughly right |
| Migration (M7–M9) | 0% | 5% | Under-weighted by 5 pts |
| Burnout (M9–M11) | 0% | 5% | Under-weighted by 5 pts |
| Year-2 planning (M12) | 5% | 2% | Roughly right |
Founders over-weight the build crest because that is the line everyone has seen — a Series-A engineering contract or a 2018 SaaS MVP looks like a $90K invoice. They under-weight the late-year peaks because no one writes “first model migration, $10K expected, $0 invoiced today” into a budget. The fix is mechanical: move 15 points of expected spend from the build bucket into two new line items (migration buffer, on-call retainer), and the year-1 budget stops surprising the CFO.
A self-test against any vendor proposal
Before signing any 2026 AI MVP proposal, run it against five questions. Each maps to one peak or the plateau.
- Build crest decomposed into eval engineering vs feature code? If the build is one bucket, the eval scaffold is silently priced at $0.
- Overlap line for hardening tail plus first-month inference in M4–M5? If launch is one phase, overlap is double-counted or zeroed.
- Eval line as a percentage of the M6–M8 plateau retainer? Below 25%, migration is being silently bet against.
- Model-migration buffer named explicitly? Defensible: “expected $0, bounded $10K, triggers on alias update from listed providers”.
- On-call retainer separate from maintenance? Combined, the M9 incident week has no budgeted owner.
A proposal that passes all five funds the year-1 curve. A proposal that fails any one funds a flat line that does not exist.
Frequently asked questions
What is a typical 2026 AI MVP year-1 total spend?
Roughly $200K for a single-workflow MVP at MVP-1 scale — $150K launch invoice across M1–M5 plus a $5–8K average run-rate across M6–M12, with two late-year peaks (migration, on-call). Below $150K, the build is missing either evals or hardening. Above $250K, the product is multi-workflow or carries compliance overlays.
Why does the build crest land in M2–M3 rather than M3–M4?
Because the architecture decision and the eval scaffold parallelise with the first feature sprint. In a 6-week build, peak engineer density is the second and third weeks — after intake (M1) is signed and before hardening (M4–M5) begins.
How often does a frontier model migration actually fire inside year one?
Anthropic, OpenAI, and Google each ship multiple major variant updates per year — cadence tracked on the Artificial Analysis LLM Leaderboard. Plan one migration in year one, two in year two.
Can the on-call burnout peak be avoided entirely?
Partly. Funding a fractional engineer on the on-call rotation from M5 flattens the peak into a $1.5–3K per month line. The founder gives up $10–15K across M5–M8 in exchange for not absorbing a 60–80 hour incident week at M9.
What does the curve look like if traffic stays flat?
The first two peaks land identically. The plateau extends. Peak 3 (migration) still fires — it is provider-driven, not traffic-driven. Peak 4 (burnout) does not fire because incident volume stays low. Total year-1 lands at roughly $170K rather than $200K.
How does the curve change for agentic workflows?
Build crest is ~25% higher (trajectory evals add a line). Plateau is lower. Migration peak is taller — agentic systems are more brittle to alias drift. Burnout peak lands earlier (M7–M9) because traffic-to-incident ratios are higher.
Is the curve the same for retrieval-augmented (RAG) MVPs?
Mostly. Build crest is slightly lower (no agent harness), plateau is slightly higher (vector store is recurring), migration peak is identical. Burnout peak is smaller — RAG failures are more visible and incident half-life is shorter.
Where does the $200K case break?
At multi-workflow scope, enterprise compliance overlays (SOC 2, HIPAA, EU AI Act high-risk), or 50K+ queries per day at launch. The curve gains a fifth peak (compliance, $30–80K across M3–M6) and a sixth (multi-tenant infra hardening, M5–M6). Shape generalises; magnitudes shift.
How does year 2 inherit from the curve?
Year 2 is dominated by two of the four peaks — migration (likely two events) and feature velocity (the line that replaces hardening). Build and launch crests do not recur. Year-2 total typically lands at $45–80K, the year-2 cost-curve drop the economics playbook describes.
What is the cheapest single change that improves the year-1 curve?
Naming the model-migration buffer and the on-call retainer as explicit line items in the M5 retainer — even at $0 expected, $10K bounded. The line by itself prevents the two late-year peaks from arriving as surprises. Cheapest insurance available in a year-1 AI MVP budget.
Where to go next
The next move depends on where you sit in the year-1 conversation.
- Pre-signature: run the self-test against the proposal in writing.
- Mid-build, crest running over: the AI MVP economics playbook gives the line-by-line frame to renegotiate.
- Post-launch, reading the plateau: AI MVP launch costs vs ongoing costs is the month-by-month walk-through.
- Heading into year two: the AI project cost curve: why year-2 spend should drop 40% traces the drop.
For the curve translated into a fixed scoping worksheet — line items, milestone triggers, buffer percentages, vendor-proposal checklist — download the SFAI Labs AI MVP Scoping Worksheet.
Arthur Wandzel