A 2024 study by CodeRabbit analyzing 153 million lines of AI-assisted code found that AI tools generate 1.7x more issues per pull request than human developers, and GitClear’s analysis of 211 million changed lines found that code churn — lines revised within two weeks of being written — is projected to double in 2024 compared to its 2021 pre-AI baseline. For non-technical founders, this creates a specific problem: you’re paying for code you cannot read, produced by tools that accelerate both output and defects simultaneously. What follows is a practical framework for assessing quality using signals, tools, and metrics that require no coding ability.
Why AI-Generated Code Demands a Different Evaluation Standard
The assumption that AI coding tools simply make developers faster is only half correct. GitClear’s 2025 research tracked a 4x growth in code clones — duplicated blocks of five or more lines — between 2021 and 2024, while the proportion of code classified as “changed” (the signal for healthy refactoring) fell from 25% to under 10%. Code is getting added faster, but it is being maintained and improved at a slower rate.
The security picture is more alarming. Georgetown’s Center for Security and Emerging Technology found that at least 62% of AI-generated programs contain known vulnerabilities. A separate study of GitHub Copilot-generated code across Python and JavaScript found that 29.5% of Python snippets and 24.2% of JavaScript snippets had security weaknesses spanning 43 Common Weakness Enumeration (CWE) categories. Eight of those CWEs are in the 2023 CWE Top-25, the definitive list of the most dangerous software weaknesses.
The implication for founders is direct: the speed of AI-assisted development creates a technical debt accumulation risk that did not exist at scale before 2022. According to CAST’s 2025 analysis of over 10 billion lines of code, global technical debt has reached 61 billion days in repair time, with US companies alone facing $2.41 trillion in annual costs.
The Four Signals a Non-Technical Founder Can Actually Measure
The goal is not to audit individual lines of code — it is to identify whether the patterns that produce bad code are present. Four measurable signals do this without requiring technical expertise.
Signal 1: Code Churn Rate
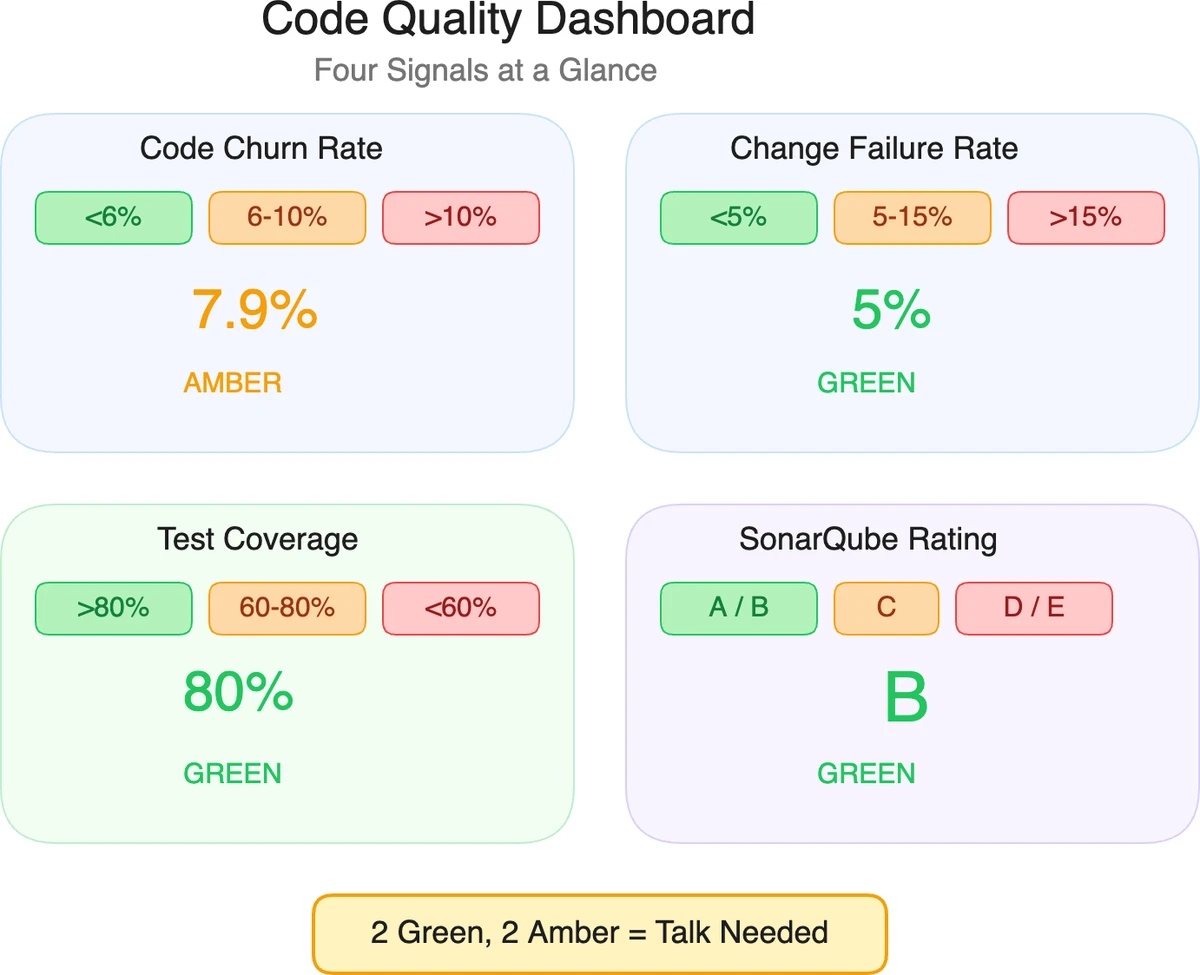
Code churn measures the percentage of lines revised or reverted within two weeks of being written. A healthy baseline sits around 5-6%; GitClear found that AI-assisted teams are running at 7.9% and climbing. Ask your development vendor to share their churn data from their version control system (GitHub, GitLab, or Bitbucket), or request access to a read-only dashboard.
High churn is not always a problem — it is expected during exploratory phases. The warning sign is sustained high churn after the architecture has been set, which indicates code is being written without adequate planning and then repeatedly patched.
Signal 2: Change Failure Rate (from DORA Metrics)
The DevOps Research and Assessment (DORA) metrics, developed through Google’s research with over 33,000 professionals, define change failure rate as the percentage of deployments that cause a failure in production. Elite-performing teams maintain a rate below 5%; average teams see 10-15%. Any vendor producing rates above 15% consistently is shipping untested or poorly reviewed code.
You do not need access to the codebase to obtain this number — it comes from the deployment pipeline logs and incident tracking tools like PagerDuty, Opsgenie, or the deployment history in GitHub Actions or CircleCI.
Signal 3: Test Coverage Percentage
Test coverage measures what proportion of the code is exercised by automated tests. Google’s internal guidelines target 85% coverage for critical paths; the general industry consensus treats 80% as the minimum acceptable threshold for production systems, with mission-critical systems requiring 90%+. Below 60% is a clear signal that testing was deprioritized in favor of shipping velocity.
Test coverage reports are generated automatically by tools built into the development workflow. Any vendor who cannot produce a test coverage report either lacks the tooling or is concealing the number.
Signal 4: Static Analysis Score
Static analysis tools scan code for bugs, vulnerabilities, and maintainability issues without running the code. SonarQube, the industry standard tool used by over 400,000 organizations, assigns a letter grade (A through E) across reliability, security, and maintainability dimensions. A rating of A or B across all three dimensions is the baseline expectation for code being delivered to a paying client. Ratings of D or E indicate systemic problems.
SonarQube Community Edition is free to self-host, while SonarQube Cloud’s Team plan starts at €30/month for analysis of up to 100,000 lines of code. Requesting that your vendor add SonarQube to the project CI/CD pipeline and share the dashboard with you is a reasonable ask — vendors who refuse this request are telling you something.
The Tool Stack: What Each Tool Measures and What It Costs
Different tools cover different dimensions of code quality. For a founder building an oversight capability, three tools cover the most important ground.
SonarQube — Code Quality and Maintainability
SonarQube scans for bugs, code smells, and security hotspots across more than 30 languages. The Community Edition is free for single-branch analysis of up to 16 languages. The commercial Developer Edition adds multi-branch analysis and deeper security rules; pricing is based on lines of code and available on the Sonar website. SonarCloud (the hosted version) starts at €30/month for teams with up to 100,000 lines of code.
SonarQube is best suited for ongoing quality monitoring rather than one-time audits. The primary output is a dashboard showing technical debt in time (e.g., “4 hours of debt introduced this sprint”), which translates quality into a business metric.
Snyk — Security Vulnerability Detection
Snyk specializes in finding security vulnerabilities in application code, open-source dependencies, containers, and infrastructure-as-code files. Snyk’s free tier supports limited scans for individual developers; the Team plan is priced at approximately $23-$25 per contributing developer per month. For a team of 10 developers, expect to pay roughly $2,760-$3,000 annually.
Snyk’s dependency scanning is particularly valuable for AI-assisted projects, because AI tools frequently import open-source libraries with known CVEs (Common Vulnerabilities and Exposures). In 2024, Snyk reported that 42% of the open-source packages used in production applications contain at least one known vulnerability.
CodeRabbit — AI-Native Code Review
CodeRabbit is an AI-powered tool that reviews pull requests and leaves comments on bugs, logic errors, security issues, and style violations. Unlike SonarQube and Snyk, CodeRabbit provides narrative explanations rather than scores, making its output accessible to non-technical stakeholders. The platform is priced at $30 per month per user and raised $60 million at a $550 million valuation in September 2025, making it the best-capitalized purpose-built code review tool in the market.
CodeRabbit’s research found that AI-generated code creates 1.7x more review comments than human-authored code. This number is both the tool’s value proposition and a quantified benchmark: if your vendor’s code is generating significantly more than 1.7x the industry average of comments per pull request, the quality gap is measurable and documented.
How to Set Up Baseline Oversight in One Week
A non-technical founder can establish a working code quality monitoring capability in five business days without touching a line of code.
Day 1-2: Audit access. Request read-only access to the project repository on GitHub or GitLab, the CI/CD pipeline dashboard, and any existing project management tool (Linear, Jira, Shortcut). Document what exists and what is missing. Missing CI/CD pipelines at the MVP stage and beyond are an immediate red flag.
Day 3: Install SonarQube Cloud. Connect SonarQube Cloud to the repository using its GitHub integration (setup takes approximately 20 minutes via the web UI, no coding required). Run the first scan and capture the baseline scores across reliability, security, and maintainability. Save a screenshot of the starting state.
Day 4: Enable Snyk. Add Snyk to the repository via its GitHub App (available in the GitHub Marketplace). Snyk will automatically scan for dependency vulnerabilities and open issues in the security tab of the repository. The initial scan report is the second input to your baseline.
Day 5: Review with your developer. Walk through the SonarQube and Snyk reports with your development lead. The goal is not to assign blame — it is to establish shared awareness of the current state and agree on a remediation priority for any critical issues. Critical-severity findings from either tool must be addressed before the next deployment to production.
This process takes roughly 4-6 hours of your time across the week and costs between $0 (SonarQube Community, Snyk free tier) and $60-80/month (SonarQube Cloud Team + Snyk Team) depending on repository size and team configuration.
Reading a SonarQube Report: The Three Numbers That Matter
SonarQube generates dozens of metrics, but three drive the most relevant business decisions.
Reliability Rating measures bugs — code that will behave incorrectly under normal conditions. An A rating means zero bugs found; each letter grade represents an order of magnitude increase in bug density. For a production application serving paying users, anything below B is a problem that needs a timeline for resolution.
Security Rating measures security vulnerabilities, not security hotspots (hotspots require manual review; vulnerabilities are confirmed risks). The threshold is the same: A or B is acceptable; C, D, or E requires immediate attention. The Security Rating is the single most important number for SaaS products handling user data.
Technical Debt is expressed in time: the estimated hours required to fix all identified code smells. A ratio below 5% (debt time versus total development time) indicates a well-maintained codebase. Deloitte’s 2024 Tech Trends report recommends organizations allocate 15% of IT budgets to technical debt remediation — if your debt is accumulating faster than 15% of your development spend, the gap will compound.
What Good Looks Like: A Concrete Benchmark Table
The following benchmarks are drawn from DORA research, SonarQube’s published data on high-performing teams, and Google’s internal engineering standards.
| Metric | Acceptable | Concern | Critical |
|---|---|---|---|
| Code churn rate | Below 6% | 7-10% | Above 10% |
| Change failure rate | Below 5% | 5-15% | Above 15% |
| Test coverage | Above 80% | 60-80% | Below 60% |
| SonarQube reliability | A or B | C | D or E |
| SonarQube security | A or B | C | D or E |
| Open critical CVEs (Snyk) | 0 | 1-3 | 4+ |
| Technical debt ratio | Below 5% | 5-15% | Above 15% |
A single metric in the “Concern” column is not a crisis — it is a conversation. Two or more metrics in the “Critical” column simultaneously indicates a development process that will require significant remediation investment before the product can scale safely.
The Contract Clause That Changes Vendor Behavior
The most effective intervention for a non-technical founder is contractual. Before signing a development contract, add a clause specifying that:
- The codebase must maintain a SonarQube Reliability and Security rating of A or B at all times.
- Critical vulnerabilities identified by Snyk must be resolved within 5 business days of identification.
- The vendor will provide read-only access to the repository, CI/CD pipeline, and code quality dashboards.
- Test coverage must remain above 75% for production-bound code.
Vendors who object to these requirements are telling you their current practices will not meet them. According to a 2024 survey cited in McKinsey’s developer productivity research, 91% of CTOs identify technical debt as their biggest challenge, yet it fails to appear in the top five priorities for most development teams. Contractual requirements change incentives in a way that voluntary standards do not.
Frequently Asked Questions
How do I know if my AI development agency is producing good quality code?
Ask for access to three artifacts: the SonarQube or equivalent static analysis dashboard, the test coverage report from the CI pipeline, and the DORA change failure rate from their deployment logs. Ratings of A or B on SonarQube, test coverage above 75%, and a change failure rate below 5% constitute a passing baseline. Agencies that cannot produce these within 48 hours of a request are likely not tracking them.
What is the cost of ignoring code quality at the MVP stage?
CAST’s 2025 research estimates that one million lines of code accumulates $1.5 million in technical debt over five years. For a startup-scale MVP of 50,000-150,000 lines, the debt accumulates proportionally at $75,000-$225,000 in eventual remediation costs — and that figure does not include the revenue lost to outages, security incidents, or the developer time Stripe estimates at $85 billion annually in global opportunity cost. The McKinsey Tech Debt Study (2024) found that 87% of CTOs cite technical debt as their top impediment to innovation.
Can I use these tools myself, or do I need a developer to set them up?
SonarQube Cloud and Snyk both offer GitHub App integrations that install via point-and-click from the GitHub Marketplace with no command-line access required. Both tools generate reports readable by non-developers — SonarQube uses letter grades with plain-English descriptions of each issue, and Snyk categorizes vulnerabilities by severity (critical, high, medium, low) with links to remediation guidance. The initial setup for both tools combined takes under an hour.
How much AI-generated code is too much?
There is no universal threshold, but the Georgetown CSET study found that 70% of organizations in 2024 estimated that over 40% of their code was AI-generated, while 92% of security leaders expressed concern about that trend. The proportion matters less than the review process: AI-generated code that passes through automated static analysis and human review before merging is significantly safer than AI-generated code that goes directly to production. The CodeRabbit research found that enabling AI review reduces the human review workload by approximately 50% while maintaining quality standards.
What is a realistic timeline for fixing a codebase with poor quality scores?
SonarQube’s built-in “new code” gate allows teams to enforce quality on new code while leaving existing debt in place. This approach — fixing forward rather than remediating the entire history — typically moves a codebase from a C rating to an A rating within 2-3 sprints (4-6 weeks) for a team of 3-5 developers. Full remediation of a codebase that has accumulated significant historical debt, including C, D, and E rated legacy modules, typically takes 3-6 months depending on scope and team allocation.
Key Takeaways
- 62% of AI-generated code contains known vulnerabilities — this is an industry-wide finding, not a vendor-specific failure. The question is whether your vendor has controls in place.
- Four metrics tell you almost everything: code churn rate, change failure rate, test coverage, and SonarQube rating. Request these before signing any development contract.
- SonarQube and Snyk cost less than one bug. SonarQube Cloud starts at €30/month; Snyk Team starts at ~$23/developer/month. A single security incident in a production application routinely costs $10,000-$100,000+ in remediation and lost revenue.
- Contractual quality gates change vendor behavior. Requiring a SonarQube A or B rating and 75% test coverage as contract terms is more effective than any review process after the fact.
- Technical debt compounds like interest. CAST estimates $1.5 million in debt per million lines over five years. Code written at MVP scale will be paid for repeatedly — either by investing in quality now, or by remediating the shortcuts later at a multiple of the original cost.
Building an AI product and need to establish quality standards before committing to a vendor? SFAI Labs builds with automated quality gates on every project — SonarQube, Snyk, and test coverage requirements are standard across all our engagements. Talk to us about what good looks like for your specific project.
SFAI Team